Free Indicators
Professional-grade trading indicators available for free on TradingView. No signup required - add them to your charts instantly.
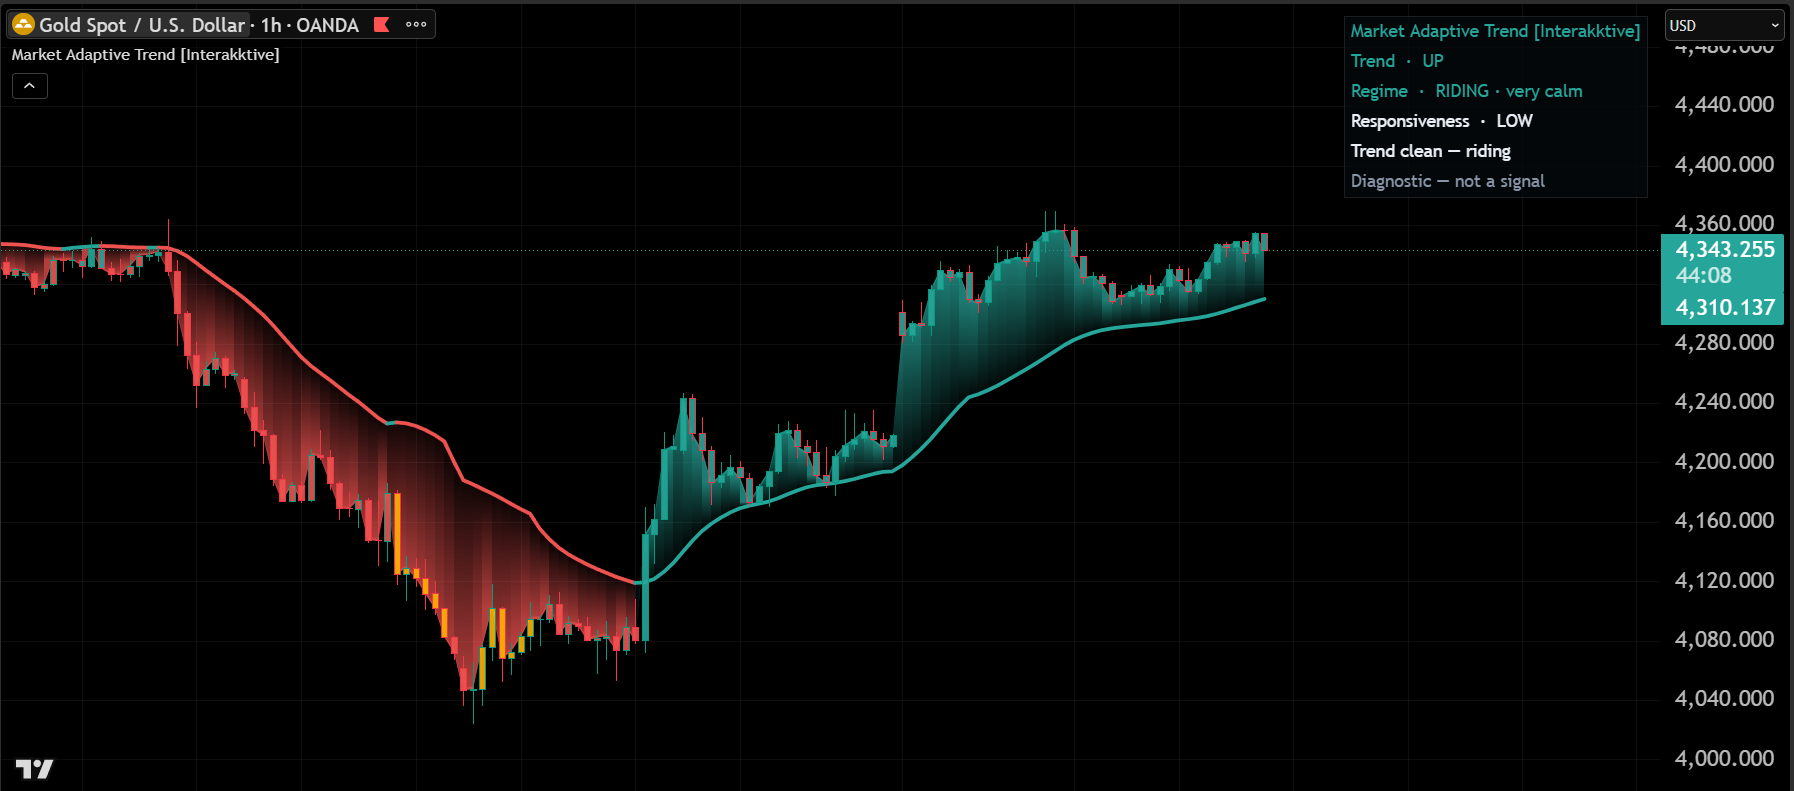
Market Adaptive Trend
Add to ChartA diagnostic trend baseline that re-tunes its own responsiveness to the live volatility regime — and narrates why, in plain English. Reveals how the trend is behaving, not where price "should" go.
Key Features:
- •Regime governor classifies volatility as RIDING, TIGHTENING, or GUARDED
- •Adaptive baseline that loosens in calm markets and damps when volatility stretches
- •Plain-English HUD: trend, regime, responsiveness, and a one-line state summary
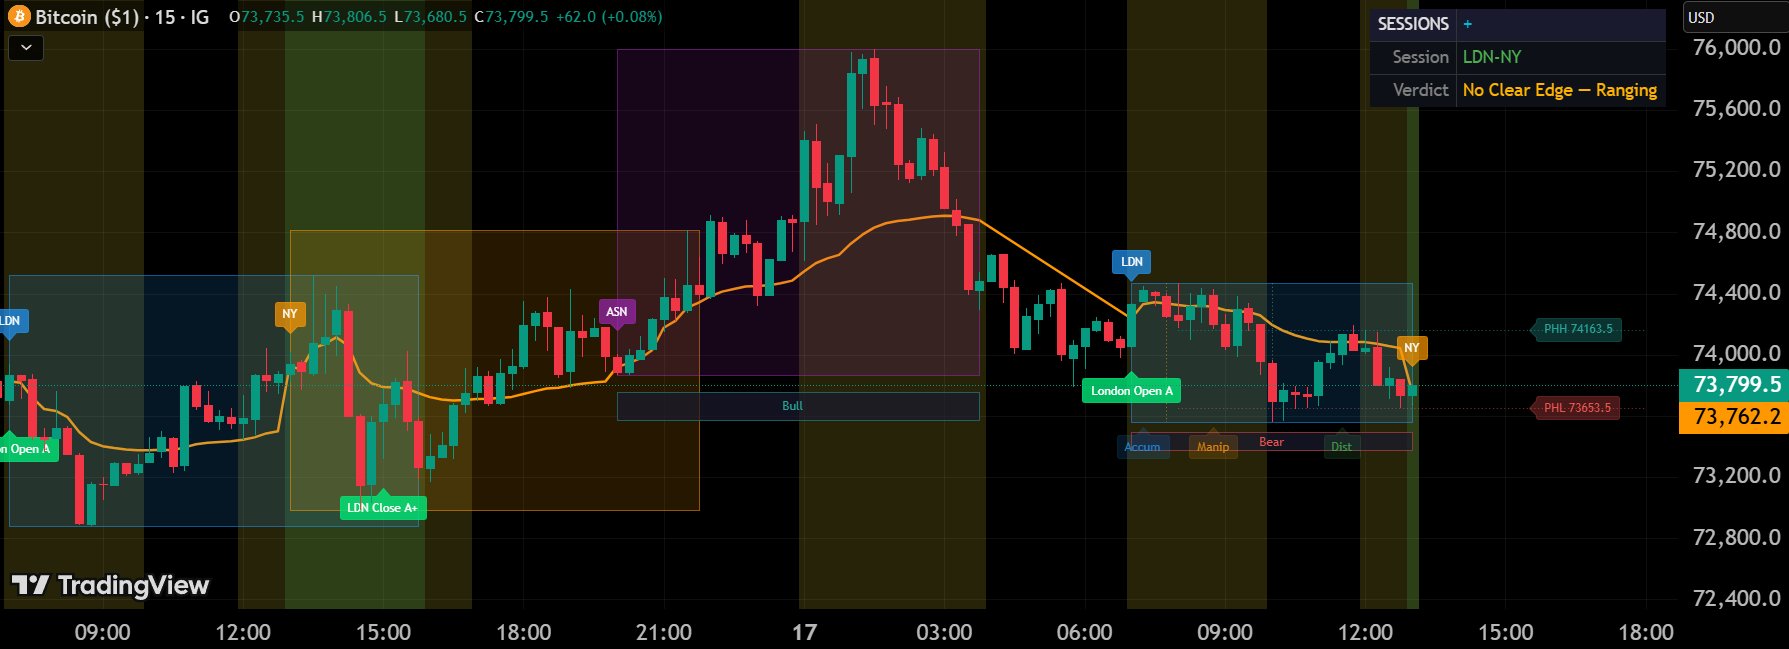
Sessions +
Add to ChartA standalone session intelligence indicator with DNA predictor narrative, adaptive multi-timeframe level degradation, and session-based structure analysis. Built as the gateway to the ATLAS suite — full diagnostic transparency with zero cost.
Key Features:
- •Session high/low tracking with adaptive level degradation
- •DNA predictor narrative box with plain English intelligence
- •Multi-timeframe level system (PHH/PHL through PQH/PQL)
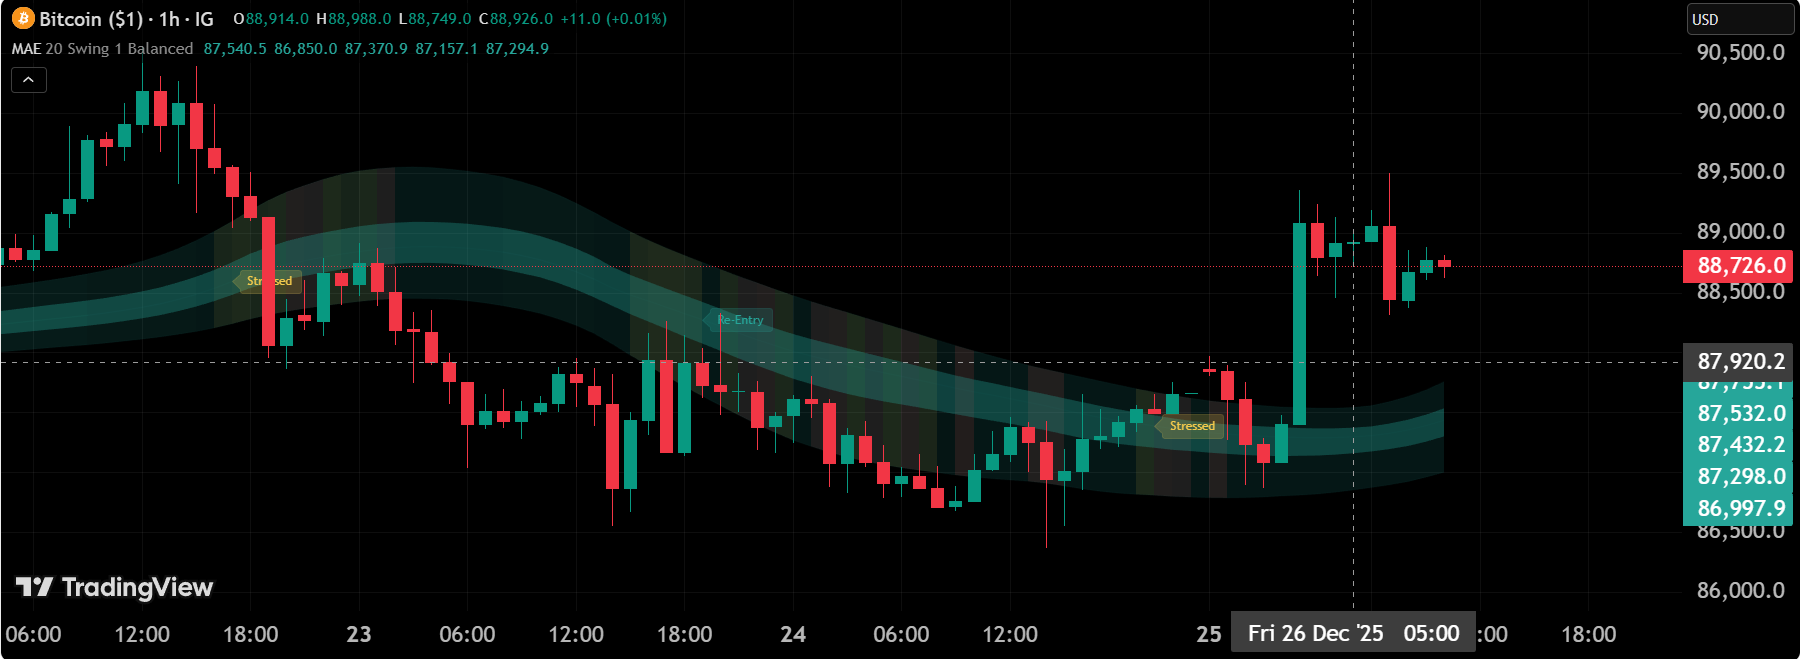
Market Acceptance Envelope
Add to ChartA dynamic envelope system that identifies institutional acceptance zones through probabilistic boundaries. Quantifies where price "belongs" based on statistical acceptance thresholds, revealing genuine support/resistance levels formed by market consensus.
Key Features:
- •Probabilistic acceptance boundaries
- •Dynamic width adjustment based on volatility states
- •Multi-standard deviation envelope layers
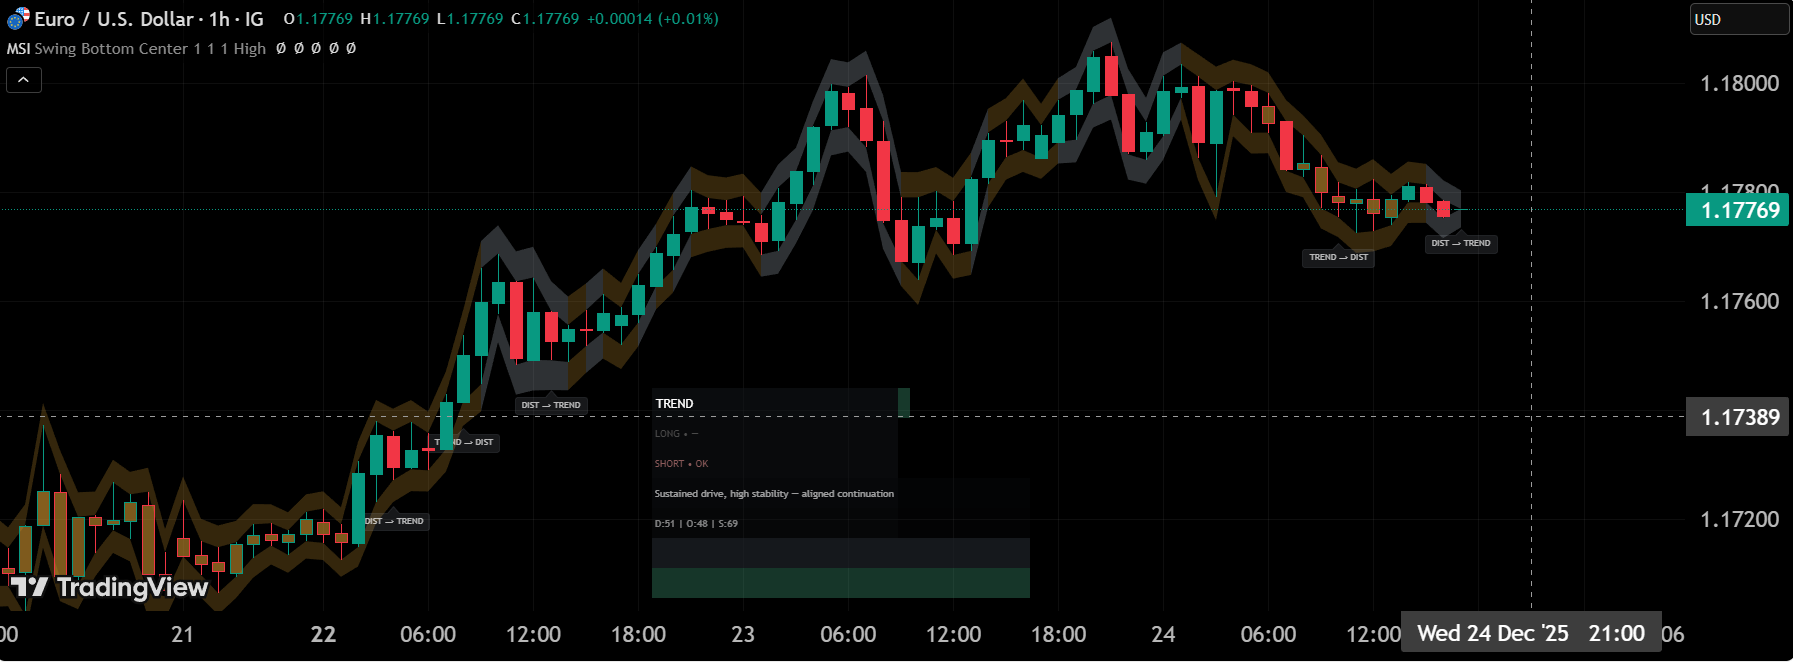
Market State Intelligence
Add to ChartA multi-dimensional regime classifier that synthesizes trend, momentum, volatility, and structure into unified market state intelligence. Provides real-time regime detection so traders can adapt strategies to current conditions.
Key Features:
- •Four-dimensional state analysis (Trend, Momentum, Volatility, Structure)
- •Real-time regime classification system
- •Composite market state scoring
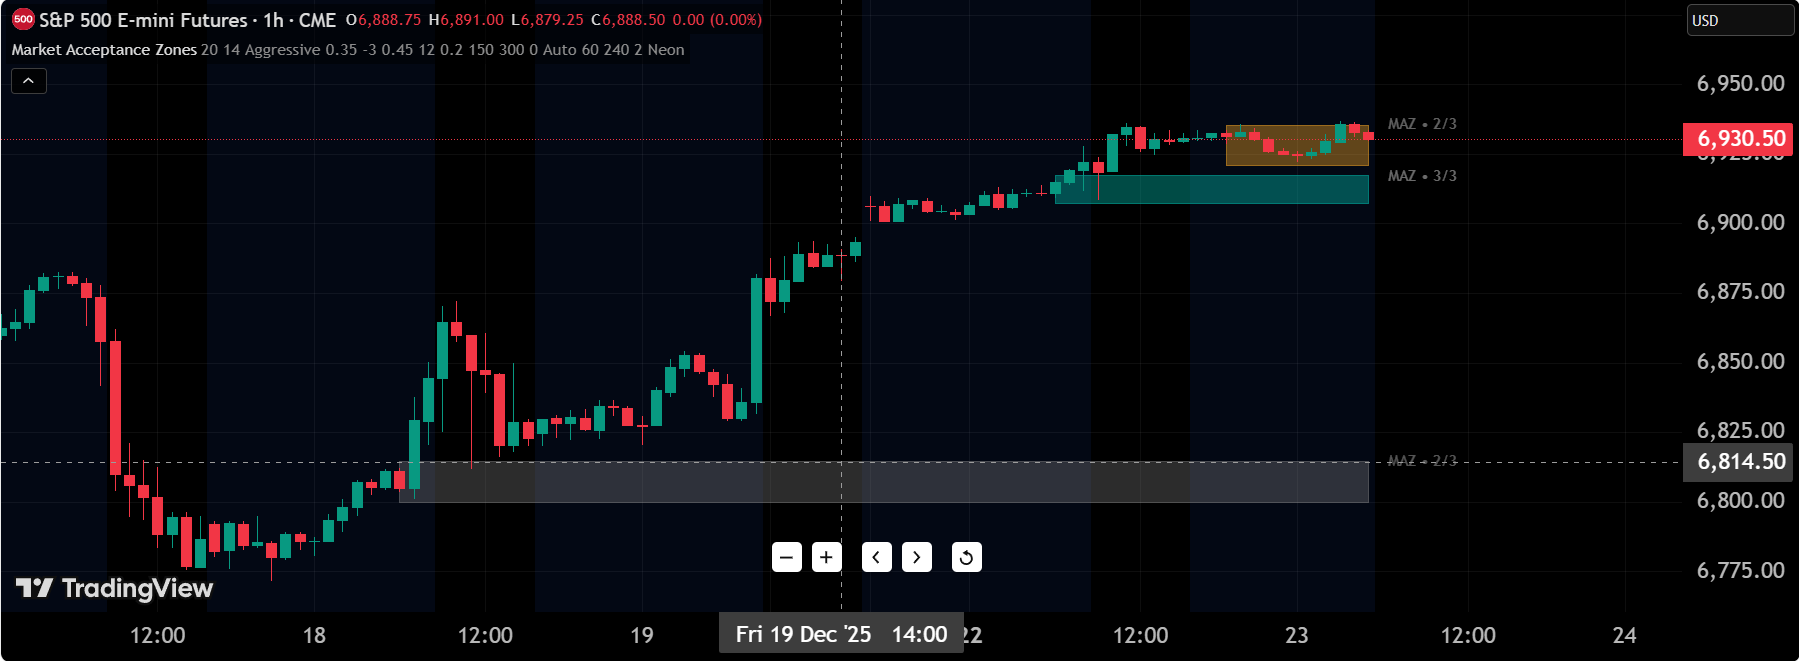
Market Acceptance Zones
Add to ChartIdentifies institutional acceptance levels where significant volume concentration and price equilibrium occurs. Maps horizontal zones representing areas of sustained interest, revealing where smart money has established positions.
Key Features:
- •Volume-weighted acceptance level detection
- •Time-at-price concentration analysis
- •Dynamic zone width based on institutional activity
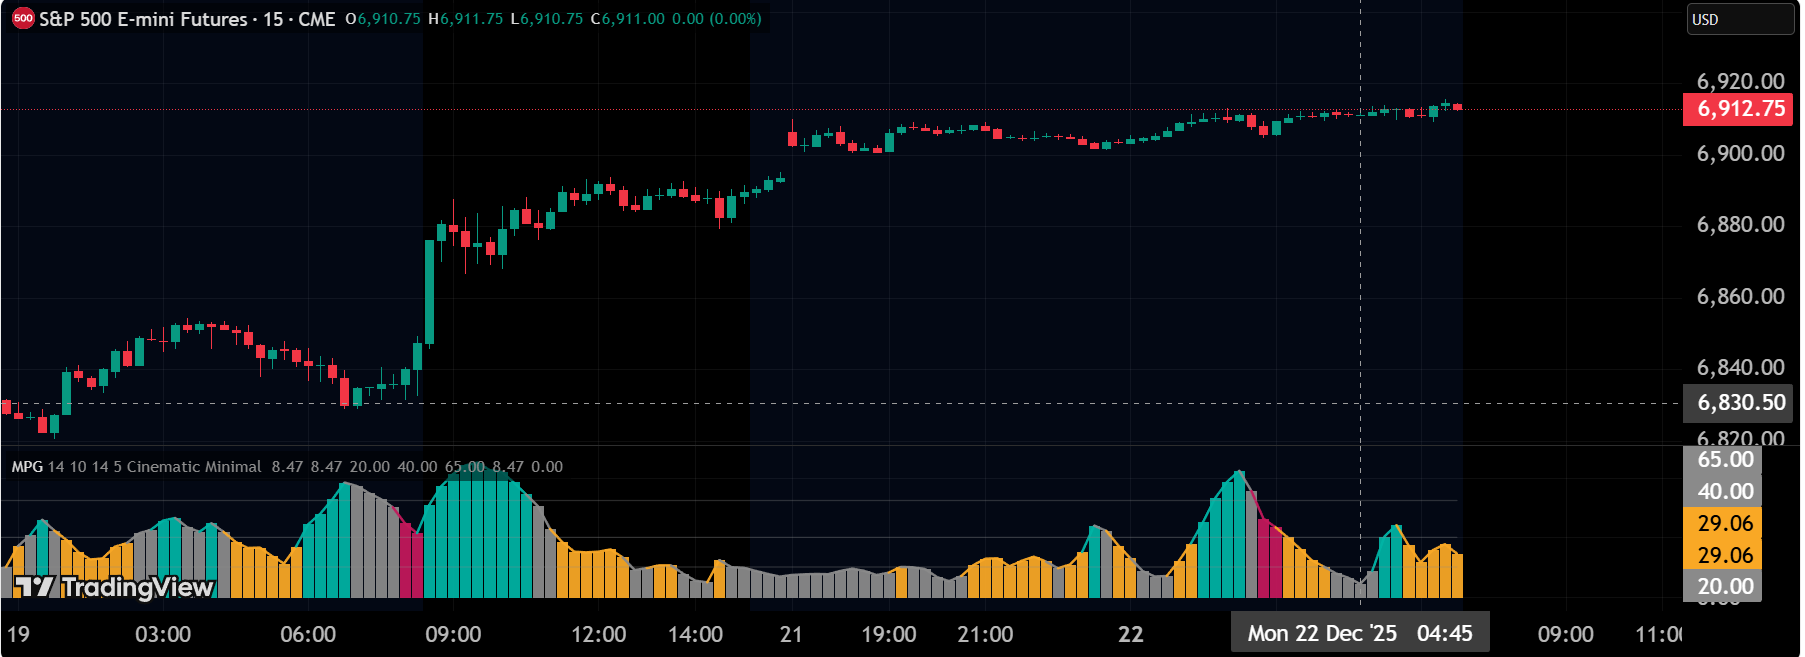
Market Participation Gradient
Add to ChartTracks the intensity and directional bias of market participation through momentum pressure analysis. Measures whether participation is accelerating or decelerating, revealing the commitment level behind price movements.
Key Features:
- •Momentum pressure intensity measurement
- •Directional participation bias detection
- •Acceleration/Deceleration gradient analysis
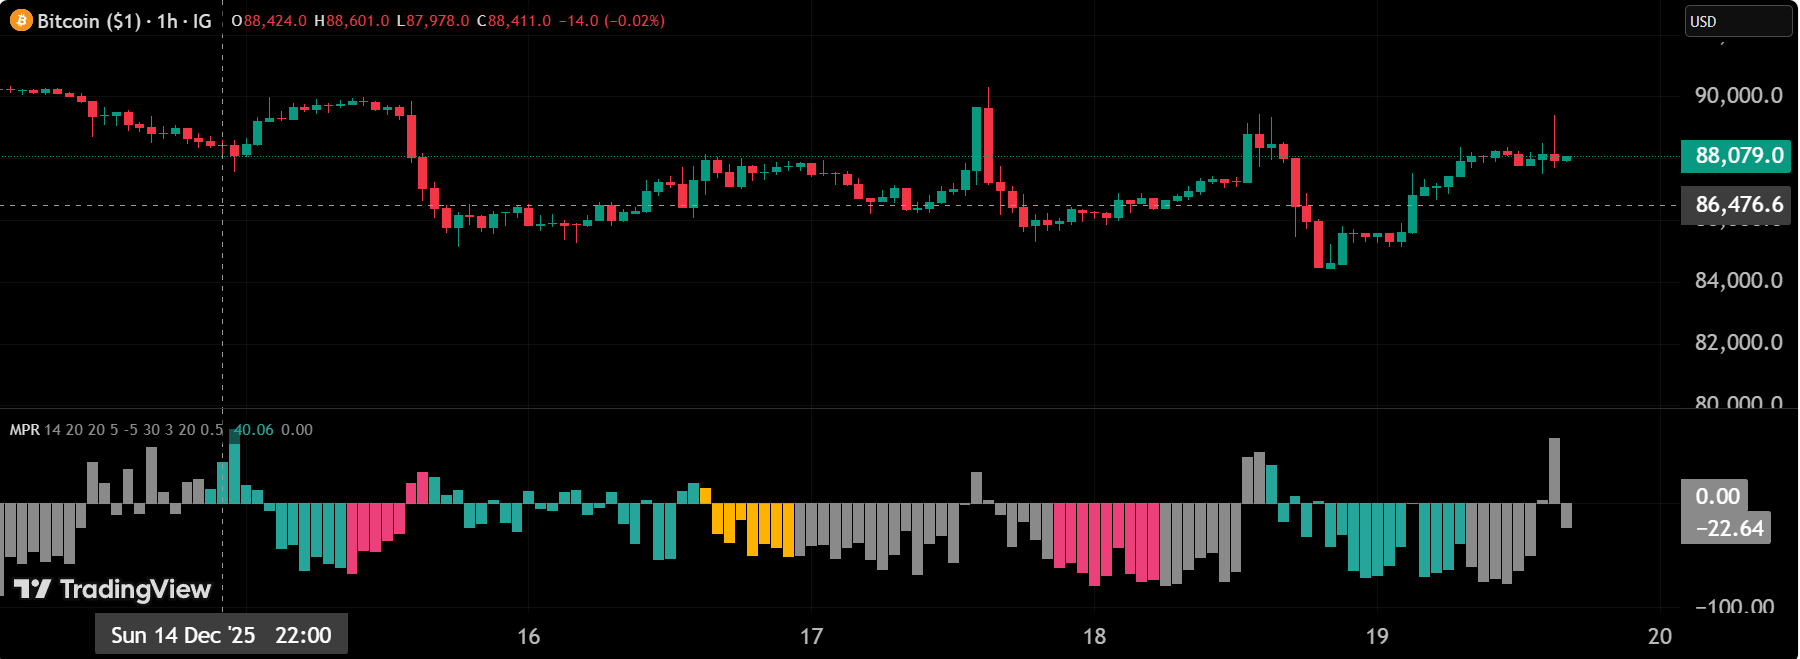
Market Pressure Regime
Add to ChartA multi-dimensional pressure state classifier that identifies whether current market conditions favour buyers, sellers, or equilibrium. Synthesizes buying pressure, selling pressure, and equilibrium metrics into actionable regime states.
Key Features:
- •Three-dimensional pressure analysis (Buy/Sell/Equilibrium)
- •Real-time regime classification system
- •Pressure intensity scoring (0-100 scale)
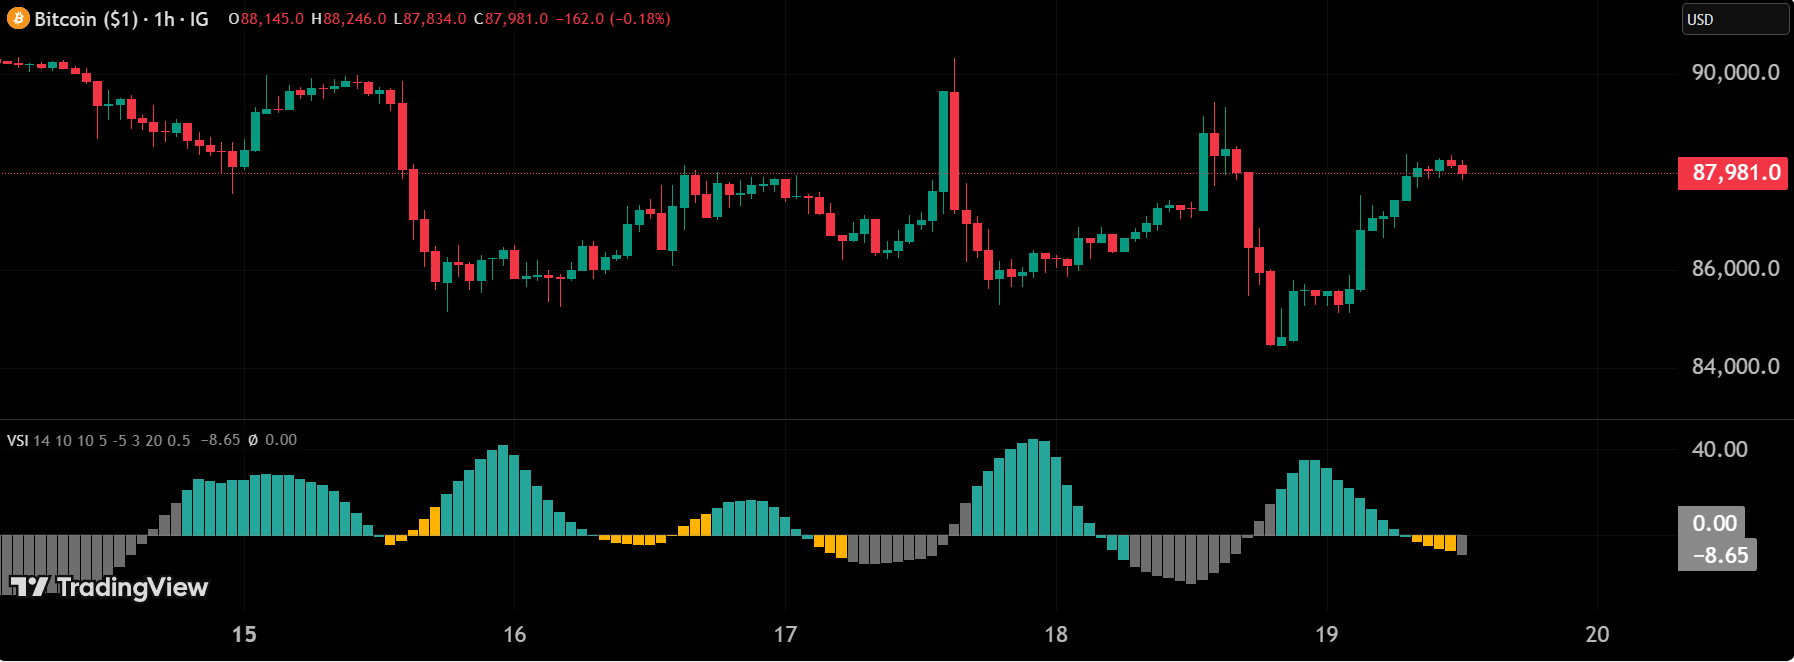
Volatility State Index
Add to ChartA volatility regime detection system that classifies current market conditions into distinct states: Expansion, Decay, and Transition. Diagnoses the current volatility regime so traders can adapt their approach accordingly.
Key Features:
- •Three-state volatility classification (Expansion/Decay/Transition)
- •Momentum analysis applied to volatility itself
- •Stability filtering to detect genuinely unstable conditions
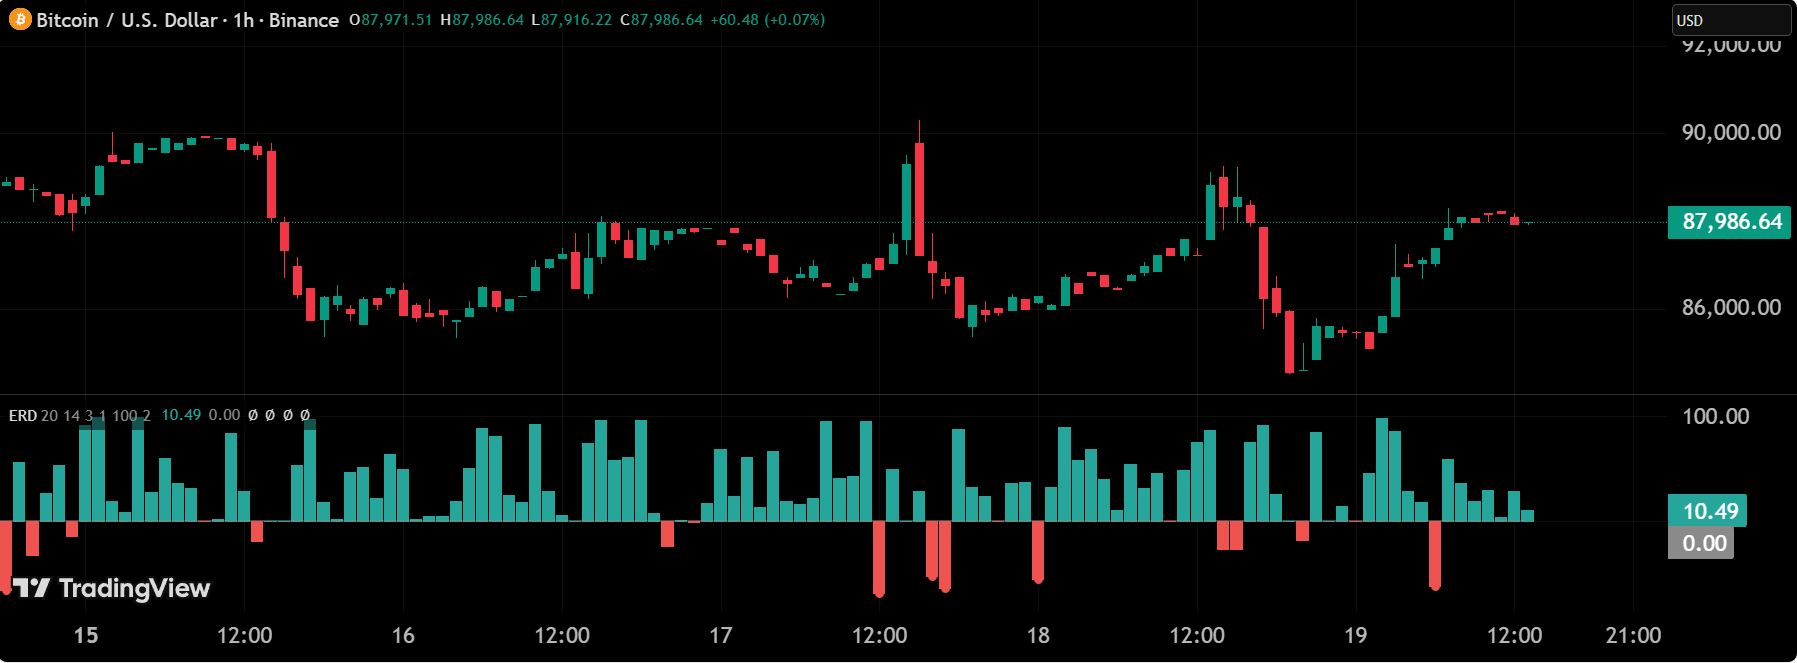
Effort-Result Divergence
Add to ChartA Wyckoff-inspired analytical tool that identifies efficiency anomalies by comparing volume effort against price result. Detects conditions revealing potential institutional activity.
Key Features:
- •Volume-Price efficiency ratio calculation
- •Effort-Result divergence detection
- •Institutional activity anomaly identification
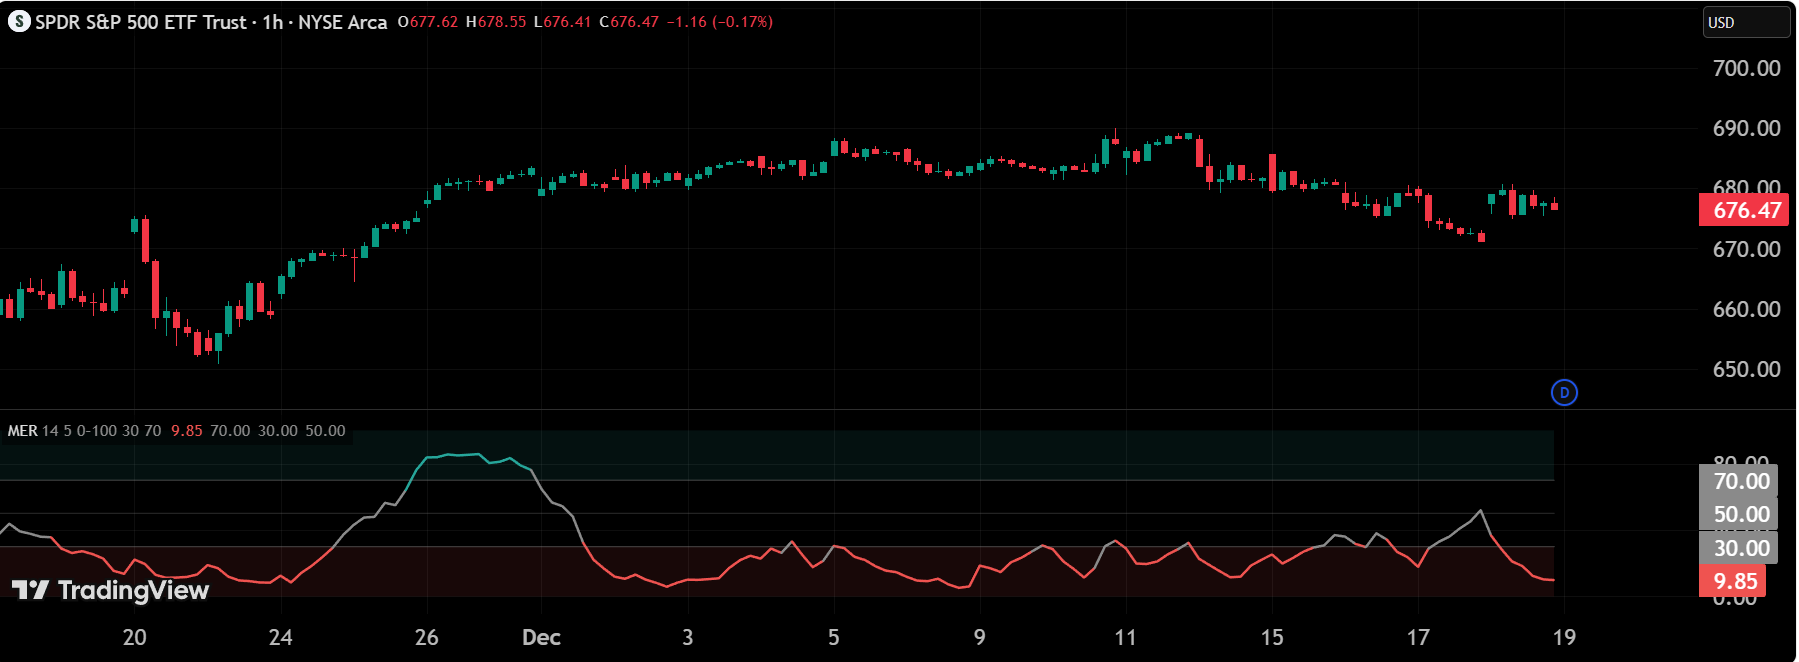
Market Efficiency Ratio
Add to ChartA diagnostic tool that decomposes price movement into directional progress versus wasted oscillatory movement. Quantifies what proportion of total travel distance represented genuine advancement versus sideways chop.
Key Features:
- •Efficiency Ratio calculation (0-100 scale)
- •Net Displacement measurement
- •Path Length tracking (total distance traveled)
Want the Full Intelligence Stack?
The ATLAS PRO suite adds signal intelligence, market structure, momentum analysis, and multi-ticker screening — all with plain English explanations.